Web Privacy Census Links |
This is an archive of the June 2012 Web Privacy Census. For the current version, visit https://www.law.berkeley.edu/index.htmlcenters/bclt/research/privacy-at-bclt/web-privacy-census/
Introduction
Public policymakers are proposing measures to give consumers more privacy rights online. These measures are based upon the assumption that the web privacy landscape has become worse for consumers; that their online activities are tracked more pervasively now than they were in the past. This assumption may be true, as online advertising and metrics companies have developed more sophisticated ways to track and identify individuals online. This has been substantiated in the academic literature, and in the popular press through an influential news series, “What they Know,” by Wall Street Journal reporters.
As policymakers consider different approaches for addressing internet privacy, it is critical to understand how interventions such as negative press attention, self-regulation, Federal Trade Commission enforcement actions, and direct regulation affect tracking. As early as 1995, Beth Givens of the Privacy Rights Clearinghouse suggested that federal agencies create benchmarks for online privacy. The first attempts of web measurement, discussed in our literature review, found relatively little tracking online in 1997–only 23 of the most popular websites were using cookies on their homepages. But within a few years, tracking for network advertising was present on many websites, and by 2011, all of the most popular websites employed cookies.
The Web Privacy Census is intended to formalize the benchmarking process and measure internet tracking consistently over time. We seek to explore:
-
How many entities are tracking users online?
-
What vectors (technologies) are most popular for tracking users?
-
Is there displacement (i.e. a shift from one tracking technology to another) in tracking practices?
-
Is there greater concentration of tracking companies online?
-
What entities have the greatest potential for online tracking and why?
This effort was developed and executed in partnership with Abine, Inc. Abine has been our technical collaborator and resource partner, helping us develop a reliable method for web crawling and analysis of tracking vectors.
In this report, we discuss the results of a crawl conducted on 5/17/12. We found cookies on all popular websites (by “popular websites,” we mean the top 100 most popular according to Quantcast). We conduct two different crawls—a shallow one where our test browser just visits the homepage of a site, and a deep crawl where our browser visits six links on a site. Our shallow crawl of the 25,000 most popular sites revealed that 87% have cookies (24% first, 76% third), 9% had HTML5 storage objects, and less than .0001% had flash cookies. Twenty-five percent of cookies include names such as “UID” and “GUID”, suggesting that they are used for uniquely identifying users. Overall, we found that flash cookie usage is dropping and HTML5 storage use is rising and at least one tracker is using HTML5 local storage to hold unique identifiers from third party cookies.
Results and Discussion
|
Description |
Date |
Type |
Sites
Crawled |
HTTP
Total Cookies |
HTTP First Party Session Cookies |
HTTP
First Party Cookies Total |
HTTP
Third Party Cookies |
Flash Cookies |
Sites using
HTML5 Local Storage |
|
Top 1k Sites |
5/17/12 |
Deep |
1k |
62,755 (62.94)
Min: 1 Max: 364 |
2,791 (3.1) Min: 1 Max: 18 |
8,302 (8.33)
Min: 1 Max: 34 |
54,453 (54.62)
Min: 1 Max: 359 |
176 (0.18)
Min: 1 Max: 10 |
311 |
|
Top 25k Sites |
5/17/12 |
Shallow |
25k |
442,055 (17.98)
Min: 1 Max: 312 |
33,404 (1.90) Min: 1 Max: 17 |
108,044 (4.39)
Min: 1 Max: 36 |
334,011 (13.58)
Min: 1 Max: 309 |
440 (0.02)
Min: 1 Max: 5 |
2,416 |
|
Top 100 Sites |
5/17/12 |
Deep |
100 |
5,795 (59.74)
Min: 3 Max: 242 |
301 (3.5) Min: 1 Max: 13 |
932 (9.61)
Min: 1 Max: 25 |
4,863 (50.13)
Min: 1 Max: 234 |
23 (0.24)
Min: 1 Max: 5 |
34 |
Top 100 websites – Deep Crawl
We detected cookies on 100% of the top 100 websites. In total, we detected 5795 HTTP cookies for the top 100 websites. 21 sites placed 100 or more cookies, including 6 that placed more than 150.
Figure 1 Distribution of Cookies on the Top 100 Sites
This graph shows the distribution of cookies for the top 100 sites. The y axis is the number of cookies, the x-axis is the sites ordered by the total number of cookies. Mousing over the graph will tell the number of cookies per site.
Most cookies— 84% of them—were placed by a third party host. We detected over 446 third party hosts among the third party cookies. Google had cookies on 16 of the top sites; the company’s ad tracking network, doubleclick.net, had cookies on 73. Combined, Google has a presence on 78 of the top websites. Only 22 lacked some type of Google cookie.
Top 5 Third Party Trackers
|
Third Party Tracker |
Number of Sites |
|
Doubleclick.net |
73 |
|
Scorecardresearch.com |
58 |
|
Adnxs.com |
48 |
|
Quantserve.com |
47 |
|
ad.yieldmanager.com |
42 |
Top 5 Trackers with most cookies
|
Third Party Tracker |
Total Number of Cookies Served |
|
bluekai |
321 |
|
rubiconproject.com |
192 |
|
adnxs.com |
177 |
|
Advertising.com |
169 |
|
Pubmatic.com |
164 |
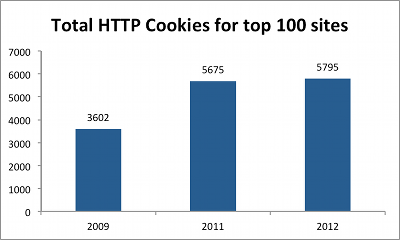
Figure 2 Total HTTP Cookies for the top 100 Websites per Report
The most frequently appearing cookie keys were: utmb,utma,utmc,utmz, uid. Many of these keys are commonly associated with unique user tracking and Google Analytics. For instance, __utma is used by Google for identifying unique visitors.
Flash Cookies
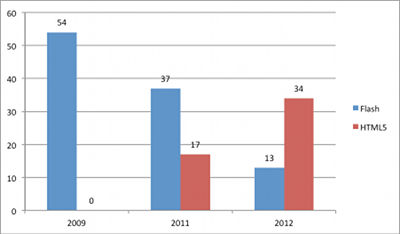
We found 23 Flash cookies on the top 100 sites compared to the 100 found in 2011. These Flash cookies appeared on 13 sites compared to 37 sites found in 2011.
HTML5 Storage
34 of the top 100 sites were using HTML5 local storage, double what we had seen in 2011. We did not collect data on HTML5 local storage in 2009.
Top 1,000 websites – Deep crawl
We detected cookies on 97.4% of the top 1000 websites. In total, we detected 63,087 HTTP cookies for the top 1000 websites. 191 sites placed 100 or more cookies, including 117 that placed more than 150.
Figure 3 Distribution of Cookies on the Top 1,000 Sites
This graph shows the distribution of cookies for the top 1000 sites. The y axis is the number of cookies, the x-axis is the sites ordered by the total number of cookies. Mousing over the graph will tell the number of cookies per site.
Most cookies— 87% of them—were placed by a third party host. We detected over 2089 third party hosts among the 54,453 third party cookies. Google had cookies on 105 of the top 1,000 sites; the company’s ad tracking network, doubleclick.net, had cookies on 685. Combined, we detected that Google has a presence on 712 of the top 1,000 websites. Only 285 lacked some type of Google cookie.
Top 5 Third Party Trackers
|
Third Party Tracker |
Number of Sites |
|
Doubleclick.net |
685 |
|
Scorecardresearch.com |
489 |
|
Adnxs.com |
404 |
|
Quantserve.com |
445 |
|
Atdmt.com |
385 |
Top 5 Trackers with most cookies
|
Third Party Tracker |
Total Number of Cookies Served |
|
bluekai |
2,906 |
|
rubiconproject.com |
2,049 |
|
Pubmatic.com |
1,673 |
|
Doubleclick.net |
1,539 |
|
adnxs.com |
1,505 |
The most frequently appearing cookie keys were: utmb,utma,utmc,utmz, pudm_AAAA. Many of these keys are commonly associated with unique user tracking.
Flash Cookies
We found 176 Flash cookies on the top 1000. These Flash cookies appeared on 110 sites (mean 0.18).
HTML5 Storage
311 of the top 1000 sites were using HTML5 local storage.
Top 25,000 websites Shallow Crawl
For the top 25,000 websites we performed a shallow crawl, hitting only the home page for each domain in the list and counting the cookies we received. The goal was to get a basic understanding of cookie counts for a wider range of sites to develop an understanding of trackers in the long tail. We detected cookies on 87% of the top 25,000 websites. In total, we detected 442,055 HTTP cookies for the top 25,000 websites. 730 sites placed 100 or more cookies, including 133 that placed more than 150.
Figure 4 Distribution of Cookies on the Top 25,000 Sites
This graph shows the distribution of cookies for the top 25,000 sites. The y axis is the number of cookies, the x-axis is the sites ordered by the total number of cookies. Mousing over the graph will tell the number of cookies per site.
Most cookies— 76% of them—were placed by a third party host. We detected over 17,949 third party hosts among the 334,011 third party cookies. Google had cookies on 770 of the top 25,000 sites; the company’s ad tracking network, doubleclick.net, had cookies on 8,554. Combined, Google has a presence on 8,993 of the top 25,000 websites. 15,596 lacked some type of Google cookie.
Top 5 Third Party Trackers
|
Third Party Tracker |
Number of Sites |
|
Doubleclick.net |
8,554 |
|
Quantserve.com |
4,817 |
|
Scorecardresearch.com |
4,565 |
|
Adnxs.com |
3,249 |
|
Twitter.com |
2,475 |
Top 5 Trackers with most cookies
|
Third Party Tracker |
Total Number of Cookies Served |
|
bluekai |
18,142 |
|
Doubleclick.net |
16,832 |
|
adnxs.com |
9,540 |
|
Scorecardresearch.com |
9,402 |
|
Casalemedia.com |
9,382 |
The most frequently appearing cookie keys were: utmb,utma,utmc,utmz,uid.
Flash Cookies
We found 440 Flash cookies on the top 25,000. These Flash cookies appeared on 344 sites (mean 0.02).
HTML5 Storage
311 of the top 1000 sites were using HTML5 local storage 2,416 of the top 25,000 sites were using HTML5 local storage.
Conclusion
This is the first report of an ongoing quarterly census of web trackers. Future reports will be able to look at trends over time and continue to provide updated measures of common trackers described in the report.
Comparing this report to previous reports, we see that since the report in the summer of 2011 there has been a marked increase in HTML5 storage usage, and a sharp decline in flash cookies. HTML5 local storage objects allow developers a great deal of flexibility for storage, as well as a much larger amount of information stored locally. An increase of HTML5 storage is not directly connected with an increase in tracking, as the HTML5 storage object can hold any information that the developer needs to store locally. However, this information can potentially contain information used to track users and persist. Flash has been losing its dominance and consequently is being used on less sites. Cookie counts continue to increase, with larger and larger amounts of third party cookies being used. Cookies are present on every website in the top 100, with approximately 34% of them using HTML5 storage, more than double the amount we counted in 2011.
We see fewer Google cookies on the top 100 sites then previously. This is most likely an artifact of the automated collection process compared to the manual process in previous years and is not reflective of a strong underlying shift. In previous years, links selected manually were chosen based on how likely they would be to contain trackers. The current automated approach ensures that all links are treated equally. However the tradeoff is that sites with large number of navigation links may keep the crawler from getting to deeper content which may contain more trackers.
Moving forward we predict that we will see even more adoption of HTML5 as well as a continue decrease in Flash Cookies. Third party trackers continue to increase and we expect this trend to continue as well. In this iteration our crawlers did not “log in” to any sites, and therefore were not able to see how cookies changed based off of additional information provided by logging into third party services. As many consumers stay logged in to one or more services while browsing the web, one consideration for future iterations is how logging in contributes to cookies and trackers.
How to cite this report:
Nathan Good & Chris Jay Hoofnagle, The Web Privacy Census, June 2012, available at https://www.law.berkeley.edu/index.htmlcenters/berkeley-center-for-law-technology/research/privacy-at-bclt/web-privacy-census/june-2012-web-privacy-census/
Sponsors
This work was supported in part by TRUST, Team for Research in Ubiquitous Secure Technology, which receives support from the National Science Foundation (NSF award number CCF-0424422).
![]()

HTML5 charts powered by ZingChart